
What is a Good Email Open Rate for Ecommerce? (And why you're asking the Wrong Question)
TL;DR: In 2026, a "good" ecommerce email open rate is around 31% for campaigns and 32% for flows, with top senders hitting 45%+. But open rates are now inflated by Apple Mail Privacy and bot activity, which makes them a shaky measure of real performance. The metrics that actually predict revenue are click rate, revenue per recipient, and attributed revenue, not opens. If you're only tracking opens, you're measuring the wrong thing. This post gives you the benchmarks, then shows you what to look at instead.
Open rates. They used to be one of the most important metrics in email marketing. But with changes in privacy and tracking (we’re looking at you, Apple Mail Privacy Opens), open rates have become inflated and increasingly unreliable as a meaningful tool for knowing how your email is performing. Do open rates matter in 2026? Yes, they do. But are there more important metrics that measure the health of your email program? Absolutely yes. Read on for the good, the bad and the ugly when it comes to email marketing.
What open rates should you expect to see in 2026
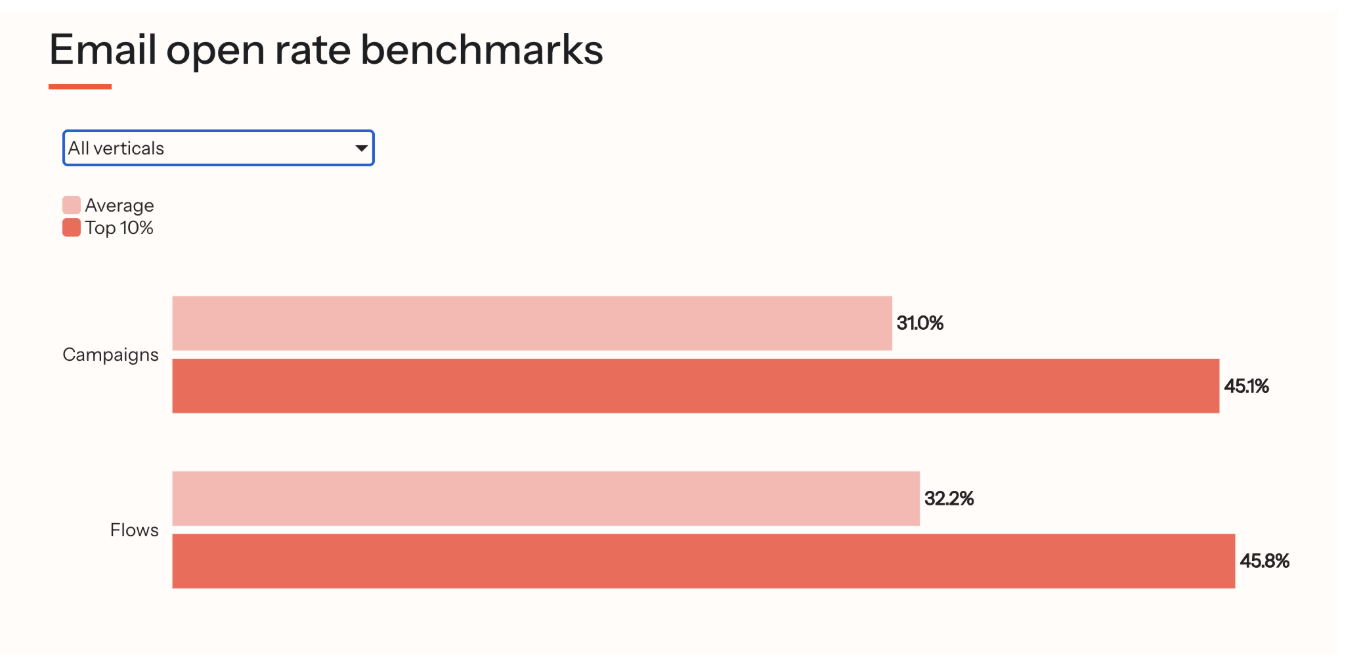
According to Klaviyo, ecommerce email senders generally see around 31% open rate for campaigns, while the top 10% of senders see open rates closer to 45%. Email flows or automations see slightly higher numbers, 32.2% open rate on average with top performers hitting 45.8%. These numbers do vary slightly by vertical, so it’s worth taking a look at Klaviyo’s chart to know what open rate you should be aiming for.
Why open rates are a misleading benchmark
But here's the thing: in 2026, open rates are largely inaccurate. Two things broke them.
Apple Mail Privacy Protection pre-loads email content in the background, which registers as an "open" whether or not the recipient ever looked at your email. With Apple Mail accounting for a huge share of email opens, a big chunk of your "opens" are automated, not human.
Bot opens do the same thing from the other direction. Security filters, spam scanners, and link-checkers open emails and fire your tracking pixel before your subscriber ever sees the message. The result is an open rate that's inflated by machines, not buyers.
So why measure open rates at all?
You still need to measure your open rates because they are a signal of deliverability and list health. But rather than focusing on the number itself, we like to look at open rates within the context of other sends. What is your personal campaign average open rate? Did this campaign perform better or worse than the average? Have you seen a drop off in open rate that is unexpected? Open rates can still be a useful metric, if you know what to look for.
The metrics that actually matter
If open rate tells you a machine loaded your email, these metrics tell you whether a human took action and spent money.
Click rate is your primary engagement KPI. It's the clearest human signal you have. Klaviyo's 2026 data shows campaigns average around 1.7% click rate, while flows average 5.6%, more than 3x higher. Top-performing flows clear 10%. Click rate isn't gamed by privacy features, so it's a far more honest read on whether your content is landing.
Revenue per recipient (RPR) answers the only question that pays your bills: how much money did each email earn? This is where the gap gets dramatic. Flows generate roughly 18x the revenue per recipient of campaigns, and top-performing flows earn as much as $7.79 per recipient. A high open rate means nothing if RPR is flat.
Placed order rate tracks how many recipients actually bought. Flows convert at roughly 13x the rate of campaigns, which is exactly why automations deserve most of your attention.
Revenue attribution ties it together across campaigns and automations. Flows drive nearly 41% of email revenue from just 5.3% of sends. Understanding this split, and looking at assisted conversions rather than only last-click wins, keeps you from over-crediting the last email someone happened to click.
Deliverability and list health underpin all of it. Watch your hard bounce rate (keep it under ~2%), spam complaint rate (under 0.1%), and unsubscribe rate (under ~0.5%). If these creep up, your open and click rates will follow them down. Healthy lists outperform big lists every time.
How to check your real email performance in Klaviyo
The good news is that Klaviyo makes it super easy to track all of these metrics right in Klaviyo. Just go to your campaign dashboard, and there is data on your last 30 days performance – along with how your numbers compare to your industry average.
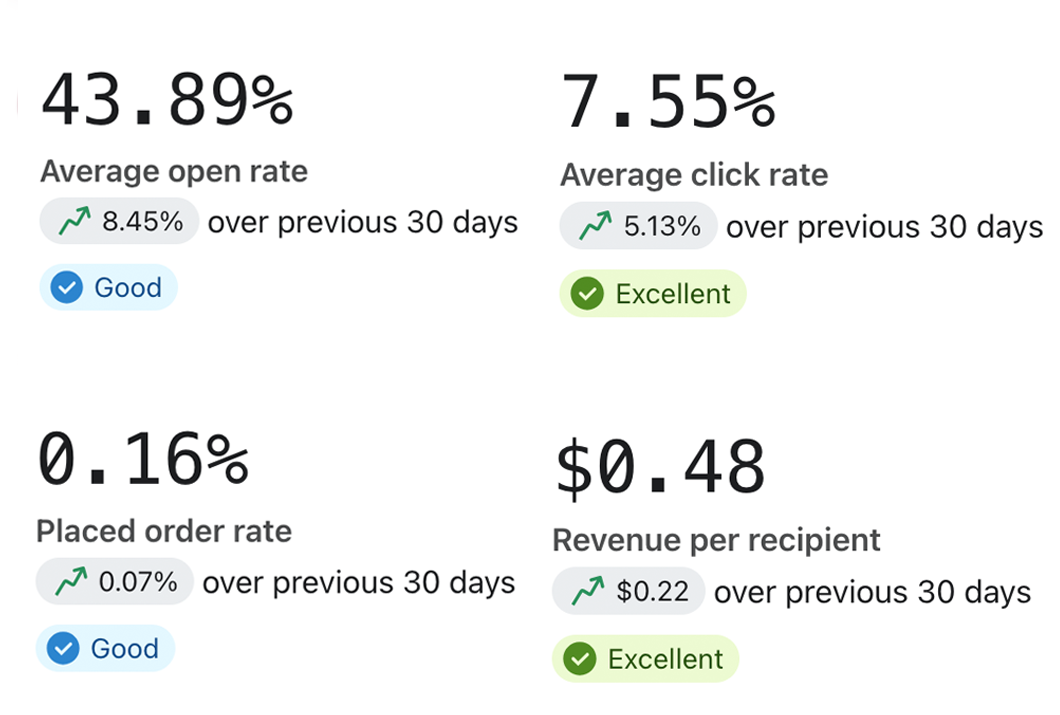
For a deeper dive into campaign and automation metrics, take a look at your overview dashboard.
If your open rates are high but revenue is low: the real question
The first thing to look at is your click rates. Are people opening your emails and clicking, or not clicking? This is an important distinction – because the answer will point you down 2 very different roads.
If click rate is high, but your emails aren’t converting: look at what’s going on with your site. Is there something making checkout difficult?
If the click rate is low and no one is buying: you have a content problem. Look at your top performing content – what do you send when people do take action? You probably need to send content that’s more engaging and relevant to your audience.
Three quick wins that move the revenue needle
1. Prioritize your flows over your campaigns. If flows earn 18x the RPR of campaigns, your welcome, browse abandonment, and abandoned checkout automations are where the money is. Make sure all three are live, segmented, and tested before you send another one-off campaign.
2. Segment by engagement, not by list size. Sending to your whole list drags down deliverability and inflates unsubscribes. Send your best content to engaged subscribers and use a sunset flow for the rest. A smaller, engaged list beats a big, cold one every time.
3. Optimize for the click, not the open. Write emails with one clear action and a strong, above-the-fold CTA. Click rate is the honest signal, so design every send to earn it.
Stop guessing. Start measuring what pays.
Your open rate can't tell you if your email is making money. We'll audit your account for free and show you exactly where you're leaving money on the table, which flows are underperforming, where clicks are dropping off, and what to fix first. Book your free email audit.
FAQs
What is a good email open rate for ecommerce in 2026?
Around 31% for campaigns and 32% for flows is the ecommerce average, with the top 10% of senders hitting 45% or higher. That said, open rates are inflated by Apple Mail Privacy and bot opens, so treat them as a rough health signal rather than a true measure of performance.
Why are my open rates so high but my sales are low?
A high open rate often reflects automated opens (Apple Mail, security bots) rather than real interest. Check your click rate next. If clicks are high but sales are low, the problem is likely on your site or at checkout. If clicks are also low, it's a content and relevance problem.
Is open rate still worth tracking?
Yes, but as a trend, not a headline number. Compare each send to your own campaign average and watch for unexpected drops, which can signal deliverability or list health issues. Don't use it to judge whether the email "worked."
What's a good email click rate for ecommerce?
Campaigns average around 1.7% and flows average around 5.6%, with top-performing flows clearing 10%. Because click rate isn't distorted by privacy features, it's a far more reliable engagement metric than opens.
What's the difference between campaign and flow benchmarks?
Flows (automations like welcome, browse abandonment, and abandoned checkout) massively outperform campaigns. They earn roughly 18x the revenue per recipient, convert at about 13x the order rate, and generate nearly 41% of email revenue from just 5.3% of sends. If you optimize one thing, optimize your flows.
What email metrics actually matter for revenue?
Click rate, revenue per recipient, placed order rate, and attributed revenue. These tell you whether a human took action and spent money, which is what open rate can no longer reliably show.
How do I check these metrics in Klaviyo?
Your campaign dashboard shows last-30-days performance alongside industry averages, and the overview dashboard breaks down campaign and automation metrics in more detail.